The FREQUENCY of the output of your patch is determined by a parameter in the Oscillator operator.  Using the simple patch you created in the 1st tutorial (Creating a Simple JSYD Patch):

  • Select the Oscillator operator.
  • Change the value in the Frequency field to 220.
  • You should see this window:
        

      • Note the

    amplitude

      • of .5.  The

    wave

      • form is a

    sine wave

      .
  • MAKE SURE YOU HAVE ENTERED .5 (50%) in the AMPLITUDE field.
  • Click the SYNTHESIZE button at the top left corner of the patch window.  You will not hear the sound of the patch until you “synthesize” it.
  • Make sure your headphones are connected to the audio output of the computer.
  • When you are ready to proceed, click the PLAY button at the top left corner of the patch window.  You should hear the sine wave play in your headphones. Or, click the link below to hear sound.sine2.aiff

    Note that the FREQUENCY of 220 Hz is ONE OCTAVE lower than the FREQUENCY of 440 Hz.

FURTHER EXPERIMENTS: Try changing the values in the Oscillator parameters window:  Remember, you have to RE-SYNTHESIZE the patch after change in order to hear the result

  • Change the frequency to another value.  For example, 110 Hz or 880 Hz.
  • Change the amplitude to another value. For example, .25 (25%); .1 (10%); .75 (75%).  Changing the value to 1.0 will produce the loudest sound with no digital noise (clipping) for the hardware of your computer.  A value greater than 1.0 will produce a “clipped” wave that will no longer be a true sine wave and will sound more like a SQUARE WAVE.

IT IS NOT RECOMMENDED THAT YOU SET THE AMPLITUDE OF THE OUTPUT TO A VALUE GREATER THAN 1.0.   IF YOU DO, MAKE SURE THAT YOU REMOVE YOUR HEADPHONES.

ALSO, IF YOU CHOOSE A WAVEFORM WITH A HIGH INTENSITY (SQUARE, SAW, ETC.) THE PERCEIVED LOUDNESS WILL BE MUCH GREATER THAN A SINE WAVE.   KEEP THE AMPLITUDE LESS THAN .5 (50%). IF YOU INCREASE THE AMPLITUDE > 50% THEN MAKE SURE THAT YOU REMOVE YOUR HEADPHONES.

The amplitude of the output of your patch is determined by a parameter in the Oscillator operator.  Using the simple patch you created in the 1st tutorial (Creating a Simple JSYD Patch):

  • Select the Oscillator operator.
    • You should see this window:


    •  


The default value in the Amplitude field is “1” — change this to .5

      • Note the

frequency

      • of 440 Hz.  The wave form is a

SINE wave

      • .


    •  
  • MAKE SURE YOU HAVE ENTERED .5 (that’s “point – 5”) in the AMPLITUDE field.
  • Click the SYNTHESIZE button at the top left corner of the patch window.  You will not hear the sound of the patch until you “synthesize” it.
  • Make sure your headphones are connected to the audio output of the computer.  Also, it is assumed that you have already checked the system audio settings and your computer will produce audio output.  PLEASE make sure you have entered a fractional (percentage) value into the amplitude field of the Oscillator parameter field.  If you enter a number greater than 1 (100% – Unity), you may produce a sound that is so loud that it may damage your hearing if your headphones are placed directly over you ears. Be cautious and place your headphones in front of your ears until you become familiar with this setting.
  • When you are ready to proceed, click the PLAY button at the top left corner of the patch window.  You should hear the SINE wave play in your headphones. Or, click the link below to hear sound.Sine.aiff

FURTHER EXPERIMENTS: Try changing other values in the Oscillator parameters window, particularly the waveform. However, if you select SQUARE wave instead of SINE wave, the perceived LOUDNESS will be much greater. So, you should set the amplitude of a SQUARE wave at about HALF that of a sine wave. What would cause this effect?

To answer this question, draw a SQUARE wave along side a SINE wave on a sheet of graph paper.  The SQUARE wave stays at the peak amplitude for a longer period of time than the SINEwave.  Consequently, it has a greater average amplitude. It may seem like this proves the point — but it doesn’t. Draw a TRIANGLE wave beside a SINE wave and compare the overall average amplitudes. The TRIANGLE wave actually has an average amplitude LESS than a SINE wave but it has a greater perceived loudness. Consequently, something else must be going on.

Perceived loudness in tones with the same frequency is linked to the COMPLEXITY of the waveform — that is, how many HARMONICS. The more harmonics, the greater the perceived loudness. The SQUARE wave is a more COMPLEX sound than a SINE wave because it contains many harmonics. Compare the two sounds:

Sine.aiff
Square.aiff

The SINE wave has no harmonics. For further understanding of this phenomenon see:

Fourier Analysis
Constructive Interference

Remember, you have to RE-SYNTHESIZE the patch after every parameter change in order to hear the result.

IT IS NOT RECOMMENDED THAT YOU SET THE AMPLITUDE OF THE OUTPUT TO A VALUE GREATER THAN 1.0.   IF YOU DO, MAKE SURE THAT YOU REMOVE YOUR HEADPHONES.

ALSO, IF YOU CHOOSE A WAVEFORM WITH A HIGH INTENSITY (SQUARE, SAW, ETC.) THE PERCEIVED LOUDNESS WILL BE MUCH GREATER THAN A SINE WAVE.   KEEP THE AMPLITUDE LESS THAN .5 (50%) and even as low as .15 (15%). IF YOU INCREASE THE AMPLITUDE OF A SQUARE WAVE > 50% THEN MAKE SURE THAT YOU REMOVE YOUR HEADPHONES.

Under normal (programming) conditions, you will want to keep the OUTPUT set to MEMORY. However, if there is occasion for you to create a SOUNDFILE from your patch such as AIFF or WAV, then follow the procedure outlined below. [Outputting your patch as a soundfile DOES NOT automatically save the patch information itself as part of the soundfile. You cannot reconstruct the patch information, operators, parameters, etc., from a soundfile so you will still have to save the patch separately.

When directing the patch output data to a file (for example, AIFF or WAV), the file is INITIALLY created in the same directory as the JSYD.jar application which created it. This has important implications and you may end of writing the soundfile in some folder which you do not intend. You can select the directory to which you wish to write the soundfile:

1. Select the Output Operator to view its parameters
2. Make SURE the JSYD,jar window is expanded so you can see the “Select” button to the right of the Audio File parameter field:

The output of the patch (sound) is determined by parameters in the Output operator. There are three possibilities:

  • Output to Memory
  • Output to AIFF File
  • Output to WAV File

The Radio Buttons select the type of output:

(1) Output to Memory — produces output directly to RAM.

(2) Output to AIFF File produces output to a soundfile in AIFF format (format Apple)

(3) Output to WAVE File produces output to a soundfile in WAV format (Windows).
 

If you select Output to AIFF File or Output to WAV File, the soundfile can then be further manipulated by a soundfile editor or simply played back as soundfiles from your WEB pages.  Choosing output to AIFF or WAV files causes JSYD to write the digital information representing the sound directly to a file when you click the SYNTHESIZE button. 

To output your SYD patch as an AIFF or WAV file:

1. Select the Output Operator and note the parameter fields.

2. Click on the radio button for AIFF or WAVE (see above graphic).

3. Click on the button “Select…” to the right of the Audio File parameter field. You will get a new window in which you can select the directory (folder) in which you wish to write the soundfile.

4 Locate the proper directory, name the file, and click the Save button.

IMPORTANT!! You are not through yet…

5. You still have to SYNTHESIZE (or re-synthesize) the patch or no data will be written to the soundfile. All you have done in the above steps 1-4 is to create a path to the directory in which you wish the soundfile to be written. THE SOUNDFILE IS NOT ACTUALLY WRITTEN UNTIL YOU CLICK THE SYNTHESIZE BUTTON on the top left of the JSYD window.

YOU MUST CLICK THE SYNTHESIZE BUTTON IN THE TOP LEFT CORNER OF THE PATCH WINDOW BEFORE THE SOUND FILE IS ACTUALLY CREATED (written) in the directory you selected.

The file ICONS are different for the SYD PATCH and for the AIFF and WAV files you export (write):

The basic JSYD file Patch is a TEXT file format with a “.syd” extension. The AIFF and WAVE files are in a standard SOUNDFILE format with either “.aiff” or “.wav” extensions.

It is GOOD PROGRAMMING PRACTICE to always name the output soundfile with the same FILENAME as the JSYD patch which created it. Note in the above example how Patch1.aiff was created by the JSYD patch, “Patch1.syd” and the Patch2.wav file was created by the JSYD patch, “Patch2.syd”.

NOTE:  There are only minor differences in the file format of AIFF and WAV. Historically, AIFF is an Apple convention and WAV is a Window’s convention. Although, most soundfile editors will read and write both formats. Not all applications will work with both formats. Consequently, you may need to change the soundfile format using a soundfile editor.

The sample rate of the patch is determined by a parameter in the Output operator. The only reason you would need to change the sample rate would be if you are using a frequency which is greater than half of the sample. See Nyquist Limit. For example, if the sample rate is set to 22050 samples per second (Hz) and you were using a frequency greater than 11025 Hz, then you would need to set the sample rate higher, sat to 44100 Hz. Otherwise you would create a kind of digital noise known as ALIASING.

To set the SAMPLE RATE of your patch:

Open the patch you created in Tutorial2.

  • Select the Output operator.
  • You should see these parameters:


    Note the value in the Rate field.

    The value in the Rate field sets the SAMPLE RATE of the sound. Standard SAMPLE RATES include:

    44100 Hz (standard CD sample rate)
    22050
    11025

It is not necessary to change the sample rate of your patch unless you are using a frequency that is greater than half the sample rate. See Nyquist Limit. Otherwise you create more data than is necessary to represent your sound. For example, at a sample rate of 22050 Hz, one minute of monophonic sound equates to approx 2.5 megabytes of memory or disk space. At 44100 Hz, one minute of monophonic sound equals 5 megabytes. A stereo sound would double the amount of memory or disk space.

The overall length of the waveform (sound) is determined by a parameter in the Output operator. To set the length of the waveform (that is, the length of time in seconds the patch will play):

  Open the simple patch you created in the 1st tutorial, Creating a Simple JSYD Patch  :

  • Select the Output operator by clicking on it once. The output operator is on the right side of the window and resembles a speaker.
  • When you have the Output operator selected, you should see these parameters at the bottom of the window:
         Note the value in the Duration field. This value sets the duration of the sound (waveform) in seconds.  Setting the duration to 4 would produce a 4 second sound.  Setting the duration to 2.5 would produce a sound of 2.5 seconds.

In addition to setting the duration of the waveform, you should also check the setting of the OUTPUT. The default should be Output to Memory.

Synthesize the sound and listen for the overall length.

Try changing the duration of the output to different values and then listen for the results. You have to SYNTHESE the patch after EACH parameter change. Otherwise you will not affect any difference in the sound you hear.

Before you complete this tutorial, close all JSYD files and quit that application.

Once you create and  SYNTHESIZE a JSYD patch you will probably want to SAVE it so you can open and edit it at a later time. To save your JSYD patch, you will have to create a new directory (folder) in the USERS folder of your computer hard drive. Do that now and name the folder something that is meaningful to you, such as “JSYD files”.

Next, you should copy the JSYD application (Jsyd.jar) from the applications folder to this new folder which you created. Although when you save a JSYD patch, you can choose any directory you want, JSYD will always write soundfiles in the same directory as the application. This will become an issue in later tutorials so it is a good idea to get in the habit of copying the JSYD application to your new directory now.

To procede, find the JSYD application you copied into your new directory from above and launch it by double clicking on it. Now either create a new patch from scratch or open the patch you created from Tutorial 1 if you saved it in the Users folder.

To save your patch, select “Save As” in the File popup menu in the top left corner of the JSYD window. Find the folder you just created in the USERS folder and select it. Save your patch by naming it something that is meaningful to you, such as “Patch1.syd”.

JSYD will automatically put the file extension, “.syd” on the end of any file name that you create. Please do NOT deviate from this convention. It is important that you see the .syd extension so you can determine the difference between JSYD files and SOUNDFILES. For example:

Patch1.syd
Patch1.aiff
Patch1.wav

You cannot recreate a JSYD patch and its unique parameters from a standard soundfile such as AIFF or WAV. So if you do not save your patch, you will not be able to recover it from a soundfile such as AIFF or WAV.

You should already have completed JSYD Tutorial 1 and have that patch open. If you did not complete that tutorial or cannot open the file, you will have to re-do that tutorial. At any rate, you will need to have a completed patch before you can procede with this tutorial.

Once you SYNTHESIZE your JSYD patch, you should be able to view a graphic representation of the waveform at the bottom of the window. To view the waveform:

1. Synthesize the patch by clicking on the SYNTHESIZE button at the top left of the window (it has a green “S”).
2. Click in a blank area of the window (not on an operator). Your window should look like this.

If your graphic area is smaller than the one above, expand it by clicking and dragging on the small button in the center and just above the graphic area.

To ZOOM IN on the waveform graphic, double-click the mouse within the graphic area :

To ZOOM OUT on the waveform graphic, hold down the COMMAND KEY and double-click the mouse within the graphic area .

To hear this sound, click on this link: JSYDSound2.aiff


To create a simple JSYD Patch:

  • Close any open JSYD files.
  • Choose NEW under the FILE menu.
    • Your window should look like this:


The JSYD window consists of a palette of OPERATORS arranged across the top and an OUTPUT operator located on the right side of the window. Also, there is an area on the bottom of the window which will display either a graphic representation of the waveform of the patch, or a specific operator’s various input and output parameters. More on this later.

To create a simple JSYD PATCH:

  • Click and drag an OSCILLATOR OPERATOR from the Operator Palette (first operator on the second row) down to the main part of the window.
  • Next, connect the output of the OSCILLATOR operator to the OUTPUT operator by clicking and dragging from the right side of the OSCILLATOR operator to the left side of the OUTPUT operator. Your cursor should change temporarily to a “pen” as you drag on the right side of the OSCILLATOR operator.

Your window should look something like this:


To see the input/output parameters of the OSCILLATOR operator, just select it by clicking on it once.

You could SYNTHESIZE the patch now but the volume of the output would be VERY LOUD.  It would be best to set the output volume of the OSCILLATOR operator to a more conservative AMPLITUDE.  Do this:

  • Select the OSCILLATOR operator by clicking it once. You should see the output parameters of the OSCILLATOR in the area at the bottom of the window and it should look like this:

In future examples, only the parameter area of the window will be shown in order to conserve space:

Change the value in the AMPLITUDE field to .5 (that’s “point” 5 (5/10ths), NOT  5.


Other parameters may not be visible until you resize the parameter field of the window. Click and drag on the DOT with is located in the center of the window just above the parameter filed. Drag it UP to reveal other parameter fields:

The FREQUENCY should remain at 440.

Note the default wave type is SINE.

Click OK to close the edit window.

After the window closes, click on the SYNTHESIZE button at the TOP left of the window (it has a green “S” on it).  This causes JSYD to COMPILE the file and store a digital representation either in MEMORY or write it directly to a file. More on this later.

To hear the sound:

  • Make sure your headphones are plugged in and the volume of the Macintosh computer is adjusted properly.
  • Click the PLAY button at the TOP left of the window. .  If you set all the parameters correctly you should hear a SINE wave at amplitude .5 for 2 seconds.
  • Compare what you hear from the JSYD patch to the sound you should hear when you click the link below:

Click on this link to hear the sound: JSYDSound1.aiff

You can save your patch by choosing “Save As” in the File popup menu in the top left corner of the JSYD window. Save your file in the USERS folder of the computer hard drive. You may not have access privileges to save files in other areas of the computer.

2000

Will Wright’s The Sims models real life. It is not the first simulation game—Utopia on Intellivision (1982), Peter Molyneaux’s Populous (1989), Sid Meier’s Civilization (1991), and Wright’s own SimCity (1989) preceded it—but it becomes the best-selling computer game ever and the most popular game with female players.

2001

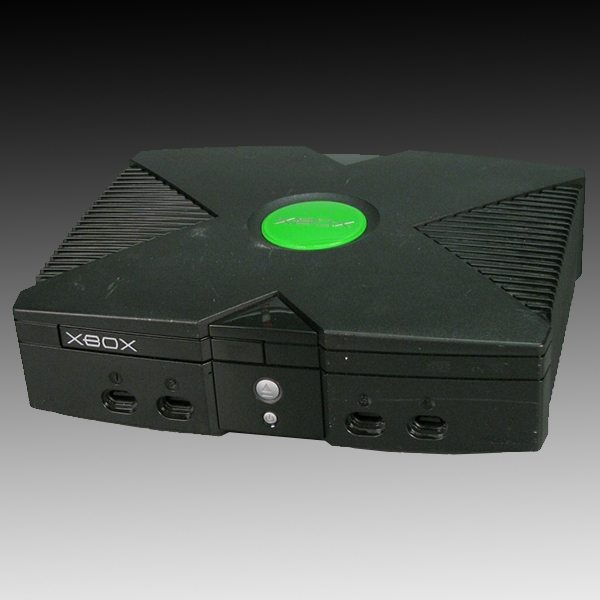
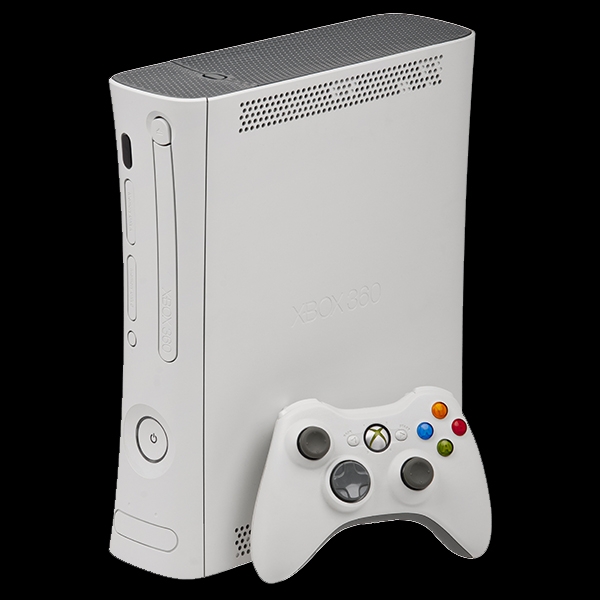
Microsoft enters the video game market with Xbox and hit games like Halo: Combat Evolved. Four years later, Xbox 360 gains millions of fans with its advanced graphics and seamless online play.

The Strong’s collections

2002

The U.S. Army releases America’s Army video game to help recruit and communicate with a new generation of electronic gamers, and the Woodrow Wilson International Center for Scholars launches the Serious Games Initiative to encourage the development of games that address policy and management issues.

The Strong’s collections

2003

Valve energizes PC gaming with its release of Steam. The digital distribution platform allows players to download, play, and update games.

2004

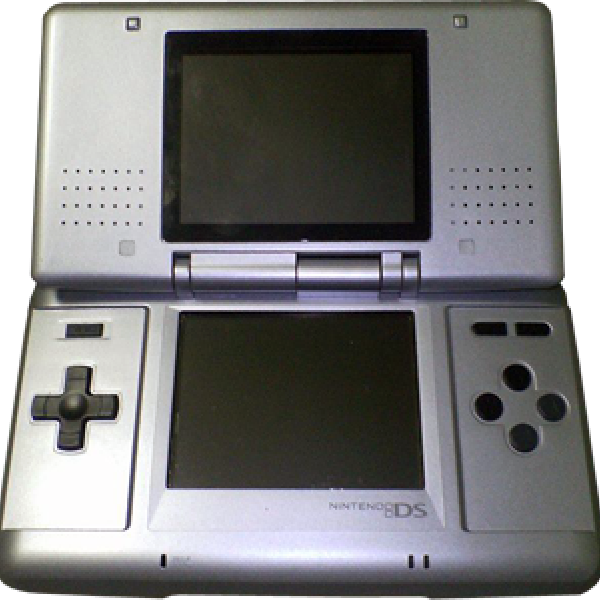
Nintendo maintains its dominance of the handheld market with the Nintendo DS, an easy-to-use, portable gaming system packed with two processors, two screens, multiplayer capabilities, and a stylus for the touchscreen. Great games like Super Mario Kart DS helped too.

The Strong’s collections

2005

Microsoft’s Xbox 360 brings high-definition realism to the game market, as well as even better multiplayer competitions on Xbox Live and popular titles such as Alan Wake.

The Strong’s collections

2006

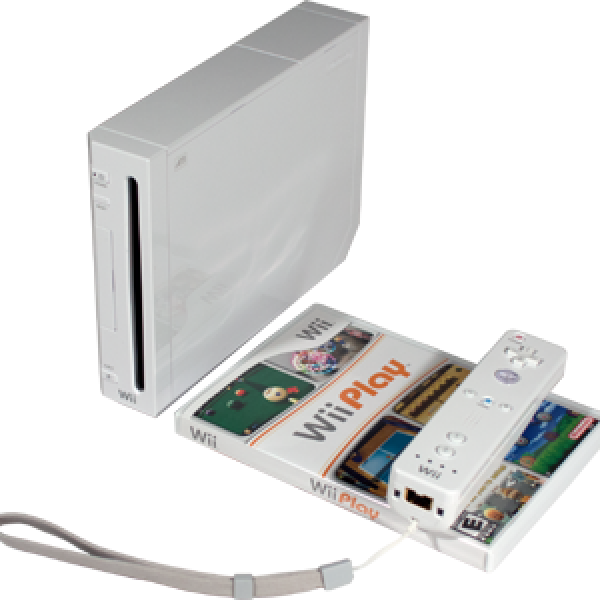
Nintendo Wii gets gamers off the couch and moving with innovative, motion-sensitive remotes. Not only does Nintendo make gaming more active, it also appeals to millions of people who never before liked video games.

The Strong’s collections

2007

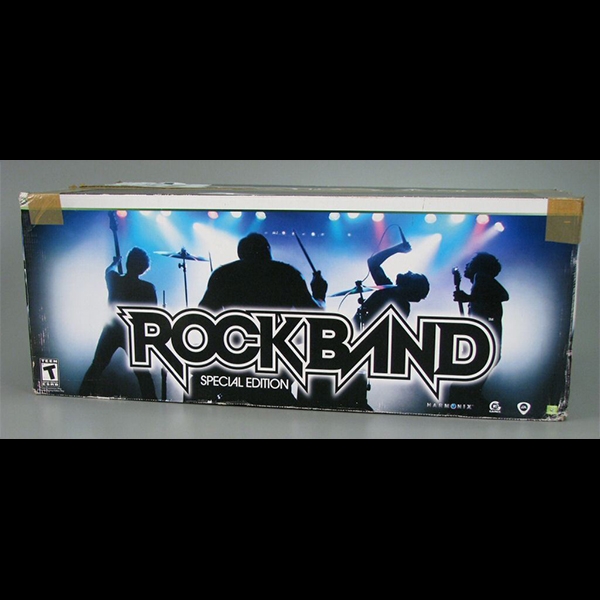
Grab your guitar, microphone, bass, or drums, and start playing Rock Band. That’s what millions of would-be musicians did with Harmonix’s hit title.

The Strong’s online collections

2008

Four years after its release, World of Warcraft surpasses 10 million subscribers, making it the most popular Massively Multiplayer Online (MMO) game ever. MMOs create entire virtual universes for players and redefine how we play, learn, and relate to one another.

2009

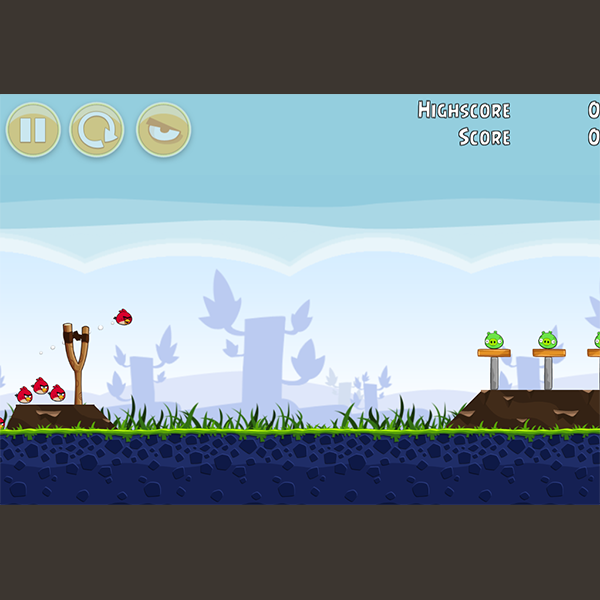
Social games like Farmville and mobile games like Angry Birds shake up the games industry. Millions of people who never would have considered themselves gamers now while away hours playing games on new platforms like Facebook and the iPhone.

Advertising in the 00s

A transformational change occurred in the 2000s. Consumer obsession with the latest product from Google or Apple often clouds recognition of the long-term effects. Things changed in ten short years.

In 2001 Bill Gates called this new decade “The Digital Decade.”

  • When the 1990s began, there were 2.6 million broadband households in the US, one out of every 40 homes. Now there are 80 million, or two thirds of the population. Broadband has gone from rare to ubiquitous.
  • Starting from zero, digital video recorders reached 31 million homes and HDTV reached 51 million in this decade. Together with online video and video on-demand, these gadgets have completely transformed the television experience.
  • Mobile phones subscriptions were up to 270 million by 2009 out of 307 million US adults. (For a comparison, mobile phones were in 51 million households in 2000, but back then having more than one phone per household was unusual.) Back in 1999 phones were phones. Now they’re iPhones, BlackBerries and Androids — computers and internet access devices.
  • Portable digital music players have reached 76% of all US households. At the start of the decade, they were in practically none, because the iPod had yet to be introduced. Mark Mulligan calls it “The Decade That Music Forgot.”

And finally, it’s worth noting that Google just celebrated its 10th anniversary. In 1999, most of hadn’t heard of it yet. And forget social technologies — in 1999, most of the social activity online was in chat and discussion forums.

Looking back on all this from the perspective of media and marketing, it’s clear that consumer lead, media stumbles along behind, and marketers follow along behind.

2009’s consumers spend 34% of their media time online. As a result, digital marketing spending has gone from $6.2 billion in 1999 to $25.6 billion, or 12% of all marketing spending, in 2009. But marketers still spend most of their energy and dollars on TV, newspapers and radio.

Within those industries, the spend shifts slower than the behavior. Newspaper sites still bring in far less than ads in the paper. Video on-demand and online video ad models are still under construction.

But what you can learn from this decade is that consumers move quickly, models move slowly, and marketing moves conservatively. When you see a technology shifting, that’s the time to begin close observation of the models behind it. It will take years for those models to take hold, and in those years, you get the chance to learn. That’s when you need to experiment and figure out how things work, because that’s when it’s cheap and the competition is hanging back. The objective is not to make money right off, but to learn the ropes. Because when the transformation happens — and it will — then you will have the advantage of knowledge.

The History of Online Advertising

1994: The first banner ads appear

first-banner-ad-hotwired.png

Image credit: Wired

On October 27, 1994, the world of advertising was forever transformed by a small graphic bearing the presumptive words, “Have you ever clicked your mouse right here? You will,” in a kitschy rainbow font. The age of banner ads had officially begun.

You can thank (or blame?) Wired magazine’s former online off-shoot HotWired for introducing the world to the enduringly ubiquitous banner ad. HotWired was a digital publication, and it needed a way to generate revenue to pay its writers.

The publication devised a plan to set aside portions of its website to sell space to advertisers, similar to how ad space is sold in a print magazine. They called the ad spaces “banner ads,” and charged advertisers an upfront cost to occupy the real estate for a set time period — very different from today’s pay-per-click model. 

AT&T paid HotWired $30,000 to place the banner ad above on their site for three months. The ad enjoyed a click-through-rate of 44% — a number that would make most marketers balk in disbelief today. To put that in perspective, the average clickthrough rate on display ads today — 22 years later — is closer to 0.06%

Users enticed to click the mysterious banner were transported to a very early landing page for AT&T. Visitors could click links to view information about landmarks and museums around the world to highlight the internet’s ability to transport you to different locations virtually.

Craig Kanarick, one of the digital consultants hired to work on the campaign, remembers the team’s goal was to make an ad that didn’t feel like an ad, and actually offered valuable content to users. “Let’s not sell somebody something,” he recalled thinking, “Let’s reward them for clicking on this thing brought to you by AT&T.” 

The banner ad concept blew up as a way for websites to keep their content ungated and free for users, and it wasn’t long before other companies — such as Time Inc. and CMP’s Tech web — were seeking out advertisers to lease banner space as a sustainable way to scale their sites. 

1995: Display ads become increasingly targeted 

As banner ads continued to gain popularity, advertisers became increasingly interested in targeting specific consumer demographics, rather than just placing their ads wherever space was offered and hoping the right people would see it. This led to the beginning of targeted ad placement.

WebConnect, an ad agency that specialized in online ads, began helping their clients identify websites their ideal consumers visited. Now, companies could place ads where their target demographics were more likely to see them.

This was nothing short of revolutionary in the digital advertising space. Not only were companies reaching more relevant audiences, but websites hosting the ads were also able to display banners that were more applicable to their visitors.

WebConnect also introduced the CustomView tool, which capped the number of times a particular user was shown a single banner ad. If a user had already seen an ad a certain number of times, they would be shown another ad instead.

Users tend to stop noticing a banner ad after they’ve seen it before, so capping the number of times a user sees an ad helped early online advertisers prevent “banner fatigue.” Ad frequency capping is still a common display ad tactic advertisers use today. 

1996: ROI tracking tools begin to improve 

In 1996, banner ads plastered the internet, but advertisers still didn’t have a good process to determine if these ads were actually driving tangible results for their businesses. Marketers needed a way to more efficiently manage their display ad campaigns across multiple websites and report on how users were interacting with their ads.

Doubleclick emerged on the scene as one of the first ROI tools for banner ad campaigns. They offered advertisers a new service called D.A.R.T. (Dynamic Advertising Reporting & Targeting), which enabled companies to track how many times an ad was viewed and clicked across multiple websites.

The most impressive feature of D.A.R.T. was the fact that advertisers now had the ability to track how their ads were performing and make changes to a live campaign. Previously, advertisers needed to wait until a campaign was completed before they could analyze the results and optimize their next banner for better performance. If an ad was performing poorly, they were forced to wait it out.

With Doubleclick, advertisers could see if an ad’s performance was suffering midway through a campaign, and they had the option to make changes. For example, if a marketer noticed their ad was underperforming on one website, they could remove the ad and devote those resources to another website where the ad was performing better.

Doubleclick’s success also gave rise to a new pricing model for online advertising: Cost per impression (CPM). Previously, websites were paid a flat fee to host banner ads for a predetermined time period. With improved ad tracking, banner pricing transitioned towards an ROI-based model.

1997: Pop-up ads quickly rise and fall 

It would be an understatement to say that pop-up ads suffer from a poor image problem. They’ve been called internet’s original sin and the most hated advertising technique, and one of the original developers has even apologized for creating the underlying code that unleashed them upon unsuspecting web surfers. Even so, these much-maligned ads hold an undeniable place in the history of online advertising.

So who created the very first pop-up? Before you get your pitchforks and torches out, you should know their intentions were good. Ethan Zuckerman, then a developer for Tripod.com, is widely credited with creating the code that enables pop-up ads to open up a new browser window.

“It was a way to associate an ad with a user’s page without putting it directly on the page, which advertisers worried would imply an association between their brand and the page’s content,” Zuckerman wrote in the Atlantic.

Amidst dwindling banner ad clickthrough rates in the late 1990s, pop-up ads first seemed like a way to save online advertising and capture the attention of increasingly ad-blind users. And while pop-ups did force users to pay attention, they didn’t actually translate to real ROI. By the early 2000s, it was standard for web browsers to come with pop-up blocking features.

1999 – 2002: Advertisers turn to paid search and pay-per-click

By this time, the web was expanding rapidly and users needed a better way to navigate the terrain. With search engines steadily gaining popularity, advertisers looking to create ads that were more targeted and less loathsome turned to sponsored search as the next digital advertising frontier.

In 1999, GoTo.com — an emerging search engine company that would later be acquired by Yahoo — introduced the first pay-for-placement search engine service. Advertisers were given the opportunity to bid for top search engine results on particular keywords. Despite some initial outcries that paid search would lead to corrupt results, GoTo.com was able to monetize their search engine through the model.

Pay-for-placement eventually evolved into pay-per-click. Companies bid on search result placement on a per-click basis: e.g., I’ll pay GoTo.com $1 per click if you put my company as the top search result. This led to search results that were largely determined by how much a company was willing to pay. The highest bidders were usually listed first, even above more relevant content, and it was unclear to users which results were paid and which were organic content.

The user experience of paid search was suffering, and one up-and-coming search engine thought they could fix it. Google introduced AdWords in 2000, originally under a pay-for-placement ad model. Google wanted to create a sponsored search experience that generated revenue without compromising the quality and relevancy of search results.

While previous paid search models like GoTo.com relied on bids from advertisers to determine search rankings, AdWords introduced a Quality Score model, which took into account an ad’s clickthrough rate when determining its placement on the search results page. Even if an ad had a lower bid, it would still appear above other, less relevant paid ads in search results thanks to its high clickthrough rate. The Quality Score model is still used today.

2006: Digital ads become hyper-targeted

As social media platforms picked up steam in the mid 2000s, advertisers sought a way to integrate ad content in a way that was both effective and non-intrusive. Marketers wanted a plan of action to reach younger internet users who were increasingly unswayed by banner ads and spending most of their internet time on social networks.

After previously resisting ads on its site, Facebook started working with advertisers in 2006 as a way to increase the young company’s profitability. They started with small display ads and sponsored links, and eventually moved onto ads targeted to a user’s demographics and interests. Despite some controversies along the way, Facebook has proven itself to be a targeted ad pioneer, changing the way that companies reach their desired audiences online.

“Our strategy is much less [about] increasing the volume of ads and much more about increasing the quality of the content and the quality of the targeting to get the right content to the right people,”Facebook founder Mark Zuckerberg said in 2014.

Targeting consumers with relevant ads — rather than bombarding them with a large volume of ad content — has become a standard practice for online advertisers, particularly on social media. Beyond Facebook’s targeting efforts, other social networks such as Twitter, YouTube, and Google+ focus on providing an advertising experience for users that doesn’t feel aggressive or impersonal.

2010 – present: Marketers find value in native ads

Around this time, a new group of media companies began to emerge. Websites like BuzzFeed and Mashable presented advertisers with new opportunities to connect with their audiences through sponsored content and native advertising

Advertisers pay to produce articles, videos, and other types of content for news and media sites. The nature of the content itself is promotional, but the format looks less like an ad and more like a regular piece of content on the host’s website.  

Instead of relying on ads that disrupt their target audience’s online experience, native advertising allows marketers to create promotional content that supplements a user’s online experience. “Marketers interested in targeting ads to specific consumers in an unobtrusive fashion should seriously consider spending some time on native,” Mimi An concluded in a HubSpot Research study on native advertising.

Websites that traditionally generated revenue from display ads began to realize that they could create a better user experience by relying primarily on native ads — rather than traditional display ads — without compromising on ad revenue. 

The Future of Advertising

That’s a look back at the history of online advertising — but what about the future?

According to recent data from HubSpot Research, 91% of respondents say ads are more intrusive today compared to just two to three years ago. It’s clear that the future of digital advertising pivots on developing a targeted ad experience that offers consumers relevant content without feeling nosy or invasive.